 Image: McZusatz, Wikimedia Commons, CC0
Where the hydrogen lines come from
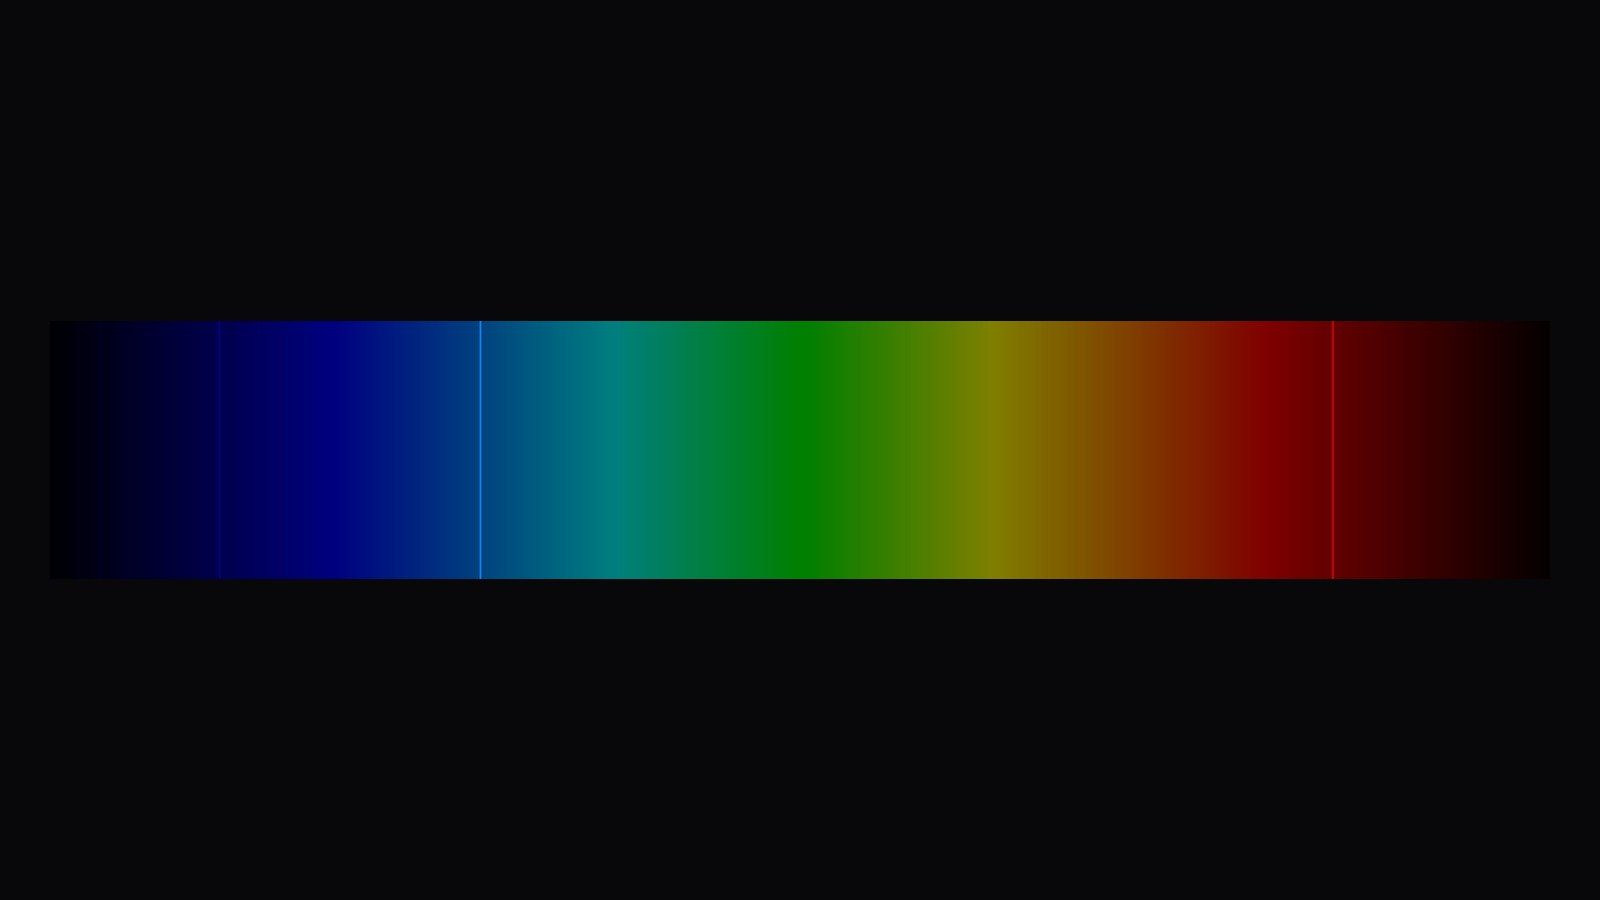
Pass an electric current through a glass tube of hydrogen at low pressure and the gas glows a pinkish red. Look at the glow through a prism or a diffraction grating and the colour separates into four lines: a strong red one, a blue-green one, a blue one, and a violet one at the edge of what the eye can see. Their wavelengths are 656.3, 486.1, 434.0, and 410.2 nanometres. Nothing else is there, no continuous rainbow, just these lines and a few fainter ones crowding together in the violet.
A schoolteacher's formula
Johann Balmer taught mathematics at a girls' school in Basel. In 1885, at the age of sixty, he noticed that the four wavelengths could be written as
\[ \lambda = B\,\frac{n^2}{n^2 - 4}, \qquad n = 3, 4, 5, 6, \]with a single constant \(B = 364.56\) nm. For \(n = 3\) the formula gives 656.2 nm, for \(n = 4\) it gives 486.1, and so on. He predicted that \(n = 7\) would give a line at 397.0 nm, and it was found. Balmer had no idea why the formula worked. The Swedish physicist Johannes Rydberg rewrote it three years later in the form that generalizes,
\[ \frac{1}{\lambda} = R\left(\frac{1}{n_1^2} - \frac{1}{n_2^2}\right), \]with \(n_1 = 2\) for Balmer's lines and \(R = 1.097 \times 10^7\) per metre. Setting \(n_1 = 1\) predicted a series in the ultraviolet, and Theodore Lyman found it in 1906, with its first line at 121.6 nm. Setting \(n_1 = 3\) predicted a series in the infrared, found by Friedrich Paschen in 1908. The formula fitted every line of hydrogen that anyone could measure, to a part in ten thousand, and nobody could say why.
Bohr's explanation
In 1913 Niels Bohr proposed that the electron in a hydrogen atom can only occupy certain orbits, numbered \(n = 1, 2, 3, \ldots\), with energies
\[ E_n = -\frac{13.6 \text{ eV}}{n^2}, \]and that light is emitted when the electron jumps from a higher orbit to a lower one, with the photon carrying away the energy difference. A jump from \(n_2\) to \(n_1\) produces a photon of energy \(E_{n_2} - E_{n_1}\), and dividing by \(hc\) gives exactly Rydberg's formula, with \(R\) expressed in terms of the electron mass, the electron charge, Planck's constant, and the speed of light. The computed value agreed with the measured one to within the accuracy of the constants. Balmer's lines were the jumps that end on the second level. Lyman's were the jumps that end on the first, Paschen's on the third.
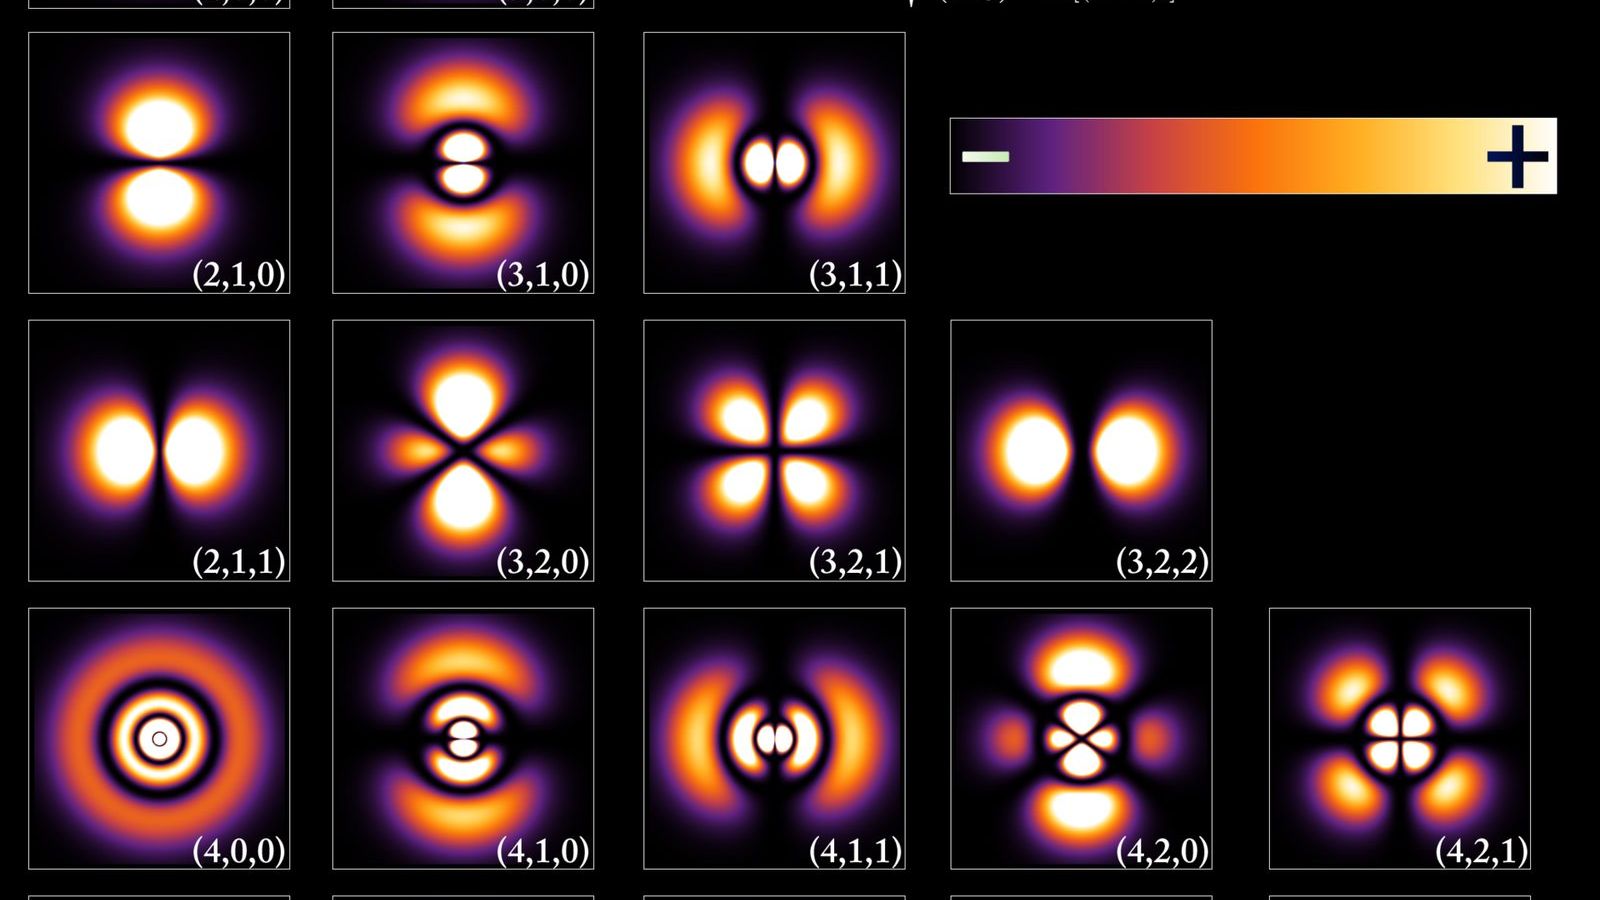
Bohr's orbits were later replaced by the wave functions of Schrödinger's equation, but the energy levels survived unchanged, because they follow from the \(1/r\) form of the electric attraction and the value of Planck's constant and nothing else. The number 13.6 eV is the energy needed to remove the electron from the lowest level altogether, and it sets the scale of all of chemistry.
Why the red line is special
The red line at 656.3 nm, the jump from the third level to the second, is called H-alpha. It is the strongest hydrogen line in visible light, and hydrogen is three quarters of all ordinary matter in the universe, so wherever hydrogen gas is warm enough to glow, H-alpha dominates. Clouds of gas lit by young stars, such as the Orion Nebula, shine red for this reason. The red fringe around the Sun during a total eclipse is H-alpha from the chromosphere. Telescopes fitted with a filter that passes only this wavelength map star-forming regions across whole galaxies.
Because the laboratory wavelength is known so precisely, any shift in the observed wavelength is a measurement of motion. A galaxy whose H-alpha line arrives at 700 nm instead of 656 nm is receding at about a fifteenth of the speed of light. Edwin Hubble's law of 1929 was built on shifts of lines like these, and the large redshift surveys that map hundreds of millions of galaxies today still rely on them.
Beyond the first approximation
Looked at closely, each Balmer line is two lines a fraction of a nanometre apart. This fine structure, as it is called, comes from the electron's spin and from relativity, and Arnold Sommerfeld computed it in 1916. Looked at even more closely, the second level has a shift of about a millionth of an electron volt that neither Bohr nor Dirac predicted, found by Willis Lamb in 1947, and explaining it required quantum electrodynamics, the theory of how electrons interact with the quantized electromagnetic field. The hydrogen spectrum has been the test bed for every improvement in the theory of the atom for a century.
The most precise hydrogen measurement of all is the frequency of the jump between the first level and the second, made in Garching by Theodor Hänsch's group with a frequency comb. Their value from 2011 has fifteen significant figures, and comparing it with theory tests the constancy of the fundamental constants and the size of the proton.
Hydrogen at 21 centimetres
There is one more hydrogen line, far from the visible, that astronomers use even more than H-alpha. In the lowest level the spins of the electron and the proton can be parallel or antiparallel, and the two arrangements differ in energy by six millionths of an electron volt. The jump between them emits a radio wave with a wavelength of 21 cm. Cold hydrogen gas, too cool to produce any visible line, fills the space between the stars and can be mapped with radio telescopes through this line. The spiral arms of the Milky Way were first traced in the 1950s this way, and the plaque on the Pioneer spacecraft uses the 21 cm transition as its unit of length.
In the Quantum Mechanics Masterclass, Unit 7 solves the Schrödinger equation for the hydrogen atom, derives the energy levels, draws the orbitals, and compares the result with the measured lines in the NIST database, which is also the unit's tool of the week. The fine structure returns in Unit 11, once spin has been introduced. The full sequence of units is in the curriculum.